Why a Number Needs Its Denominator
Why a number needs its denominator: learn to pair a reported count with its relevant total, choose a fair comparison, and spot what the figure leaves unclear.
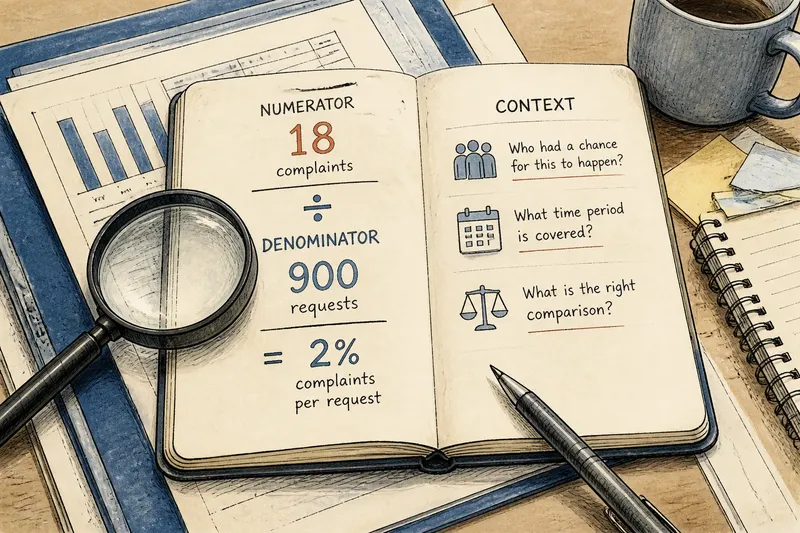
A local report says that 18 complaints were filed against a public office last month. Before deciding whether that sounds alarming, ask what the count is measured against: 18 complaints out of how many interactions, and compared with what period or group? Why a number needs its denominator is a basic question of evidence, not a trick for dismissing an inconvenient figure.
A count can be accurate and still give a distorted impression when its scale is missing. The denominator supplies that scale: it is the total number of cases, people, events, or opportunities from which the reported count came. The useful denominator depends on the claim being made, so there is no single comparison that suits every story.
What the denominator does
Suppose a story reports the number of complaints, applications, injuries, or successful outcomes. That numerator tells you how many events were counted. The denominator tells you the size of the group in which those events could have occurred.
Imagine a neighborhood office receives 18 complaints during a month in which it handles 900 requests. In a separate month, another office receives 12 complaints while handling 120 requests. The first office has the larger raw count, but the second has more complaints relative to its workload. Those figures alone do not establish why the difference exists, but the denominator changes which initial impression is reasonable.
Readers may also encounter a rate, share, or fraction rather than a raw count. Those forms make a relationship more visible, but only if the denominator is defined and relevant. A statement such as “complaints per request” is more informative than “complaints” alone, yet it still needs a clear account of what counts as a complaint and a request.
When a story gives only the numerator, treat it as a partial description rather than a complete measure.
Three ways to compare
There are several reasonable approaches to putting a number in context. The right one depends on what the story is trying to describe and what decision a reader needs to make.
Raw counts
A raw count suits questions about workload or volume: How many reports must an agency review? How many seats are needed? How many events were recorded? Counts are easy to understand and can matter on their own when the total burden is the point.
But a count is a poor stand-in for likelihood or performance if the groups differ in size or exposure. A larger school, service, or town may record more events simply because more people use it. Keep the count, but do not infer that one group faces greater risk or performs worse without a fitting comparison.
Rates and shares
A rate relates a count to a relevant total, such as complaints per request or missed appointments per scheduled appointment. A share describes the portion of a defined group with a particular feature. These approaches suit comparisons where group size differs and the question concerns relative frequency.
They can mislead if the denominator is too broad, too narrow, or mismatched to the event. Complaints per resident may not answer a question about service quality if only some residents used the service. A useful denominator reflects who had a genuine chance to experience the event.
Matched comparisons
A matched comparison sets figures beside a relevant baseline: the same measure across comparable periods, locations, or groups. It suits questions about change or difference, provided the compared groups were counted in a similar way and had comparable opportunities for the event to occur.
For instance, comparing this month with a previous month may be unhelpful if one period includes a major service disruption and the other does not. A comparison across two offices may also need context about the kinds of requests each handles. Matching improves the question; it does not explain the cause of a difference by itself.
Which comparison fits?
When is a raw count enough?
A raw count can be enough when the claim is strictly about volume, such as the number of forms awaiting review. If the story shifts from volume to risk, quality, or relative performance, ask for a denominator that reflects the relevant population or opportunity.
What makes a denominator relevant?
It should include the cases that could reasonably have produced the numerator and exclude unrelated cases. Ask whether the denominator refers to people, visits, applications, or another unit, and whether that unit matches the event being counted.
How should I compare two rates?
Check that both rates use comparable definitions, time periods, and populations. If those differ, the gap may reflect the way the figures were collected rather than a meaningful difference in the underlying events.
What if the denominator is missing?
Keep the reported count in view, but avoid treating it as a rate or a ranking. Look for the total in the story’s accompanying material or ask the publisher what population and period the count covers.
Check the units
A denominator is not useful merely because it is present. First identify the unit of the numerator: individual people, incidents, reports, visits, or something else. Then see whether the denominator counts the corresponding people or opportunities.
A figure of 18 reports divided by 900 service requests answers a different question from 18 reports divided by the office’s full population. The first relates reports to use of the service; the second relates them to the broader community. Neither is automatically correct. Choose according to whether the claim concerns users’ experience or the community’s overall burden.
Also check whether the numerator and denominator cover the same time and place. A count from one month paired with an annual total can create a comparison that is difficult to interpret. If the units do not line up, the arithmetic may still be possible, but the result may not answer the question a reader thinks it does.
Read the change carefully
Even a well-chosen rate can leave important questions open. A rate may rise because the numerator increased, because the denominator shrank, or because both changed. Ask what happened to each component before deciding what the movement means.
Imagine a city office receives more complaints after moving its forms online and making them easier to submit. The count and complaint rate might rise, but that alone would not show whether service worsened: more residents may now be able to report problems. A useful next question is whether the number of requests, the kinds of complaints, or the reporting process also changed.
Watch for changes in definitions, too. If an organization starts counting a newly included category of incident, a later figure may not be directly comparable with an earlier one. The number can be correct under both definitions while the apparent trend overstates or obscures change.
Keep “what changed?” separate from “why did it change?” A denominator can make a comparison fairer; it cannot, by itself, identify the cause.
Make a quick reading
When a story gives you a striking figure, use this short check before drawing a conclusion:
- Find the numerator. What exactly was counted?
- Ask for the denominator. What total or group gives that count its scale?
- Check the match. Did those cases have a reasonable chance to produce the counted event?
- Align the units. Do numerator and denominator refer to compatible people, events, places, and periods?
- Look for a comparison. Is there a relevant baseline, and was it counted in the same way?
- Separate description from explanation. Does the figure show a difference, or is the story also claiming to explain its cause?
Say you read that one library branch recorded more late returns than another. If you want to know which branch handled the greater number of late returns, the raw counts may answer that. If you want to compare how often borrowed items came back late, ask for late returns relative to total loans, then check that both branches used the same counting period and rules.
That distinction is the practical reason why a number needs its denominator. It helps you choose between volume, relative frequency, and a matched comparison without pretending that any one figure answers every question. When the denominator is absent or poorly matched, treat the number as a starting point and ask what total would make the claim precise.